
The Part You Rewound. The Person You Were When You Did.
It is a Tuesday night and the kitchen is quiet. You have a video paused on the laptop while the kettle finishes. The person on screen has just said something that made you actually laugh, and you cannot remember exactly how the line went, so you slide the scrubber back six seconds and let her say it again. Then six seconds. Then six seconds. By the third pass you have the line. You start the kettle pouring and let the video continue. Nobody knows you did that. Or, more accurately, one specific graph at YouTube knows you did it, and so did a few thousand other people who chose to go back to that exact six seconds tonight.
That graph turned four years old today. On May 19, 2022, YouTube rolled out the Most Replayed feature to all users. A gray heatmap quietly appeared above the progress bar of every eligible video, with little hills and valleys marking the seconds viewers chose to rewind and watch again. The peak - the single tallest hill - is the second the audience would not let go of.
This morning, Ethan wrote about what that graph means for creators. His piece is the analytics case: the heatmap is one of the most honest signals in YouTube Studio, and most creators have never opened it. He is right. The thing I want to add tonight is what the same graph means for the rest of us. For the woman pouring the kettle. For the person who watched the magic trick three times in a row, who needed to be sure. For the friend who learned every word of Hamilton by scrubbing back over the same eight bars for a month. The heatmap is the only chart YouTube has ever made of the audience choosing, deliberately, to live with a moment for a second time. Four years in, it is still the closest thing the platform has to a portrait of who we were when we sat up.
The Graph Is Not About the Video. It Is About the Hand on the Scrubber.
The Most Replayed heatmap is unlike every other chart YouTube has ever shown a creator, and unlike every other chart it has ever shown a viewer. Retention measures who stayed. Likes measure who clicked. Comments measure who typed. All of those things can happen passively, or accidentally, or with one finger half on the screen and the rest of the room demanding your attention.
Rewinding cannot. To make the heatmap go up at second 4:13, you had to stop moving forward, deliberately seek backward to second 4:07, and then watch the same six seconds again. That is two choices. That is your eyes coming back to the screen, your finger landing on a specific pixel of the progress bar, your willingness to spend the next six seconds the same way you spent the last six. Multiply that by a few thousand people doing it on the same evening on the same video, and you get a hill on a graph.
The Most Replayed heatmap is the only chart in YouTube Studio that measures the audience trying to memorize. It is the only chart that measures the audience refusing to leave a moment.
Ethan, in his analytics frame, calls the three shapes of peak the I almost missed that moment, the I need to see that again moment, and the that's the clip moment. He is naming them from the creator's side - what a peak teaches you about your pacing, your edit, your timing. I want to name the same three shapes from the viewer's side. Same peaks. Same six seconds. Different question. The question is not what did my audience need. The question is what was I asking the video for when I went back.
Three Reasons We Rewound. Three Different People Doing the Rewinding.
The audience is not one audience. The rewinder at midnight, half-asleep, going back to confirm she heard a recipe correctly, is not the same rewinder as the eleven-year-old going back to memorize a joke from a video that has been online longer than she has been alive. They press the same button. They make the same hill on the graph. They are doing three different things.
1. The Rewind That Wants to Memorize
This is the rewind for density. The line came at you too fast, or the recipe step was over before you were ready, or the explanation was clear at the time but went out of your head the second the next sentence began. You scrub back. You watch the six seconds again, slower this time because you know what is coming. You move forward only when you have it.
The clearest version of this rewind I know of is the audience that grew up on Bill Wurtz's history of the entire world, i guess. The video is a twenty-minute animated rush through the entire history of everything, narrated at the pace of someone telling you a joke they cannot wait to finish. It was the top trending video on YouTube the day it came out in May 2017, the most-upvoted YouTube link in Reddit history, and as of March 2026 it has crossed 182 million views. Thrillist ranked it the 40th greatest YouTube video of all time. Every couple of seconds there is a one-liner you will quote for the rest of your life, if you can hold on to it. Most people cannot hold on to it on the first watch. So they go back.
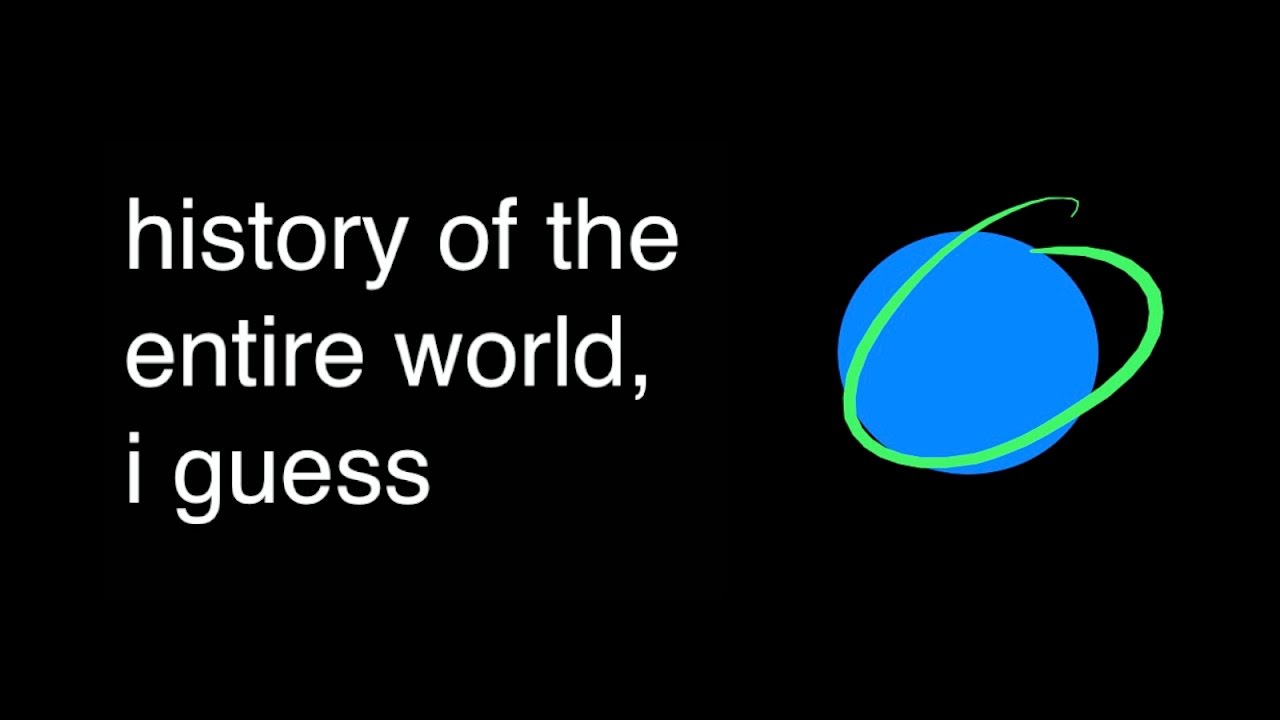
Twenty minutes. The whole story. A line every two seconds. The audience has been quietly memorizing the same eight bars about the sun for nine years.
If you ever watched this video with a friend who already knew it, you watched her mouth the words to hey check it out, there's a… fun half a second before the screen got there. She did not start knowing it. She built that line into her own head one rewind at a time, on a kitchen table, in a dorm, in a study hall, scrubbing the cursor back six seconds at a time until the joke became muscle memory. Multiply her by a few hundred thousand and you get the kind of heatmap that looks like a forest of small even hills - not one peak, but the whole twenty minutes dense with little ones, because the audience refused to let any sentence go.
This is the rewind of leaning in. It says: I am not ready to lose this. I want to live with this line a second time before the next one arrives.
2. The Rewind That Wants to Verify
This is the rewind for disbelief. The thing on screen was not confusing. It was, to the part of you that knows how the world works, impossible. So you went back, not to understand it better, but to confirm you saw it.
Destin Sandlin's The Backwards Brain Bicycle on Smarter Every Day is the canonical version of this rewind. A welder built him a bicycle whose handlebars steer the front wheel in the opposite direction. Destin tries to ride it. He cannot. He has been riding a bicycle his entire life, and he cannot do it. He tries every day for eight months. The moment in the video where he first realizes his brain will not allow him to switch the direction, the moment he wobbles two feet and falls, is a moment most people watching go back to. Not because they were unsure. Because the brain wants a second look at a thing the world is not supposed to do.
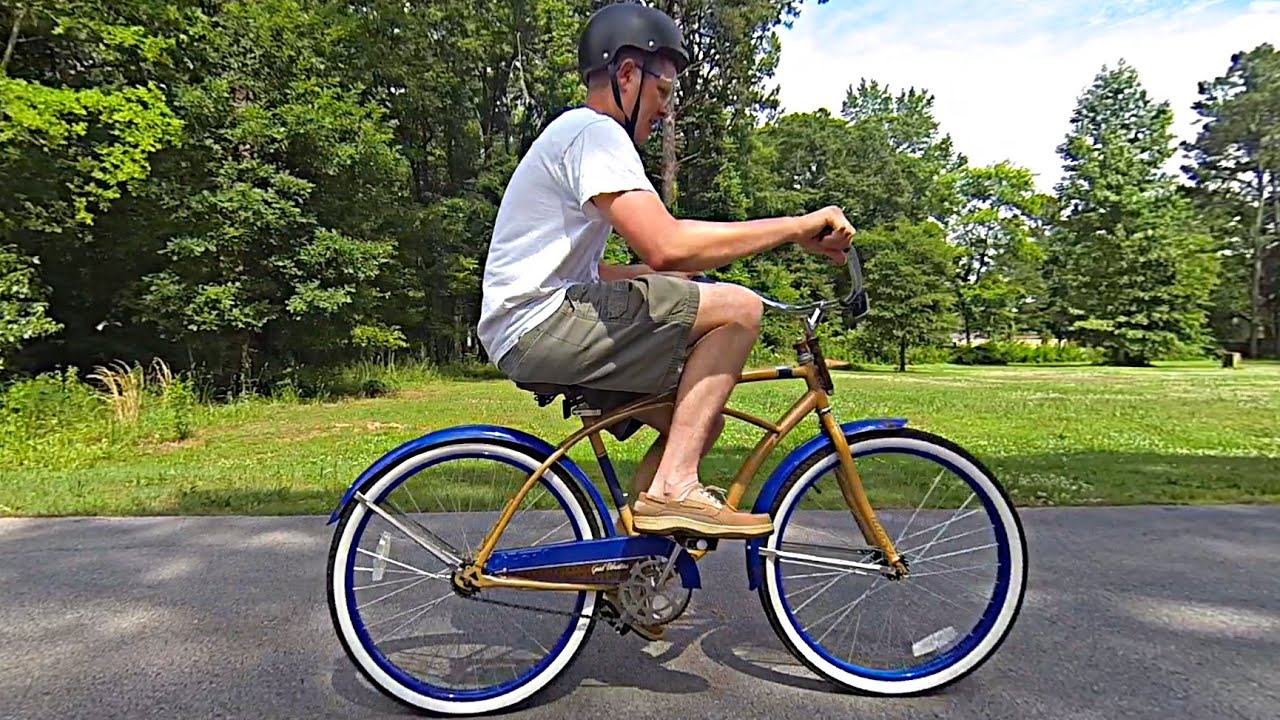
The bike steers the opposite way. A grown man who has ridden bicycles all his life cannot make it down the driveway. The first time it happens on screen, the audience instinctively goes back to confirm.
The verify rewind is the same rewind that happens under good magic videos, sports highlights with an impossible catch, science demonstrations where the egg does not break. The trick worked. You saw it work. And yet, before you let the video move on, you need one more pass to anchor it to what is real. The audience does this in unison without coordinating. The heatmap turns into a single sharp spike at the exact second of the impossible thing - the moment Destin's front wheel turned the wrong way, the moment the gymnast stuck the landing, the moment the magician opened his empty hands.
This rewind is quieter than the memorize rewind, but it asks more of the viewer. It says: I am not going to let the platform move me past this until I am certain it actually happened.
3. The Rewind That Wants to Feel It Again
This is the rewind for pleasure. The moment was not confusing. The moment was not impossible. The moment was just very, very good, and you wanted to have it twice.
The OK Go music video for Here It Goes Again went up on YouTube in 2006, in the very early days of the site. Four men in matching costumes dancing a complete choreographed routine on a row of treadmills, in one continuous take, for three minutes. The video became, in the words of its Wikipedia entry, "a staple on YouTube" with more than 69 million views. Twenty years on, you can still hear the song start and feel the muscle memory of getting ready for the moment about a minute in when the four of them lock into the same step at the same time and you can see the choreography settle, and you scrub the cursor back ten seconds because you want to feel that lock again before the kettle finishes.
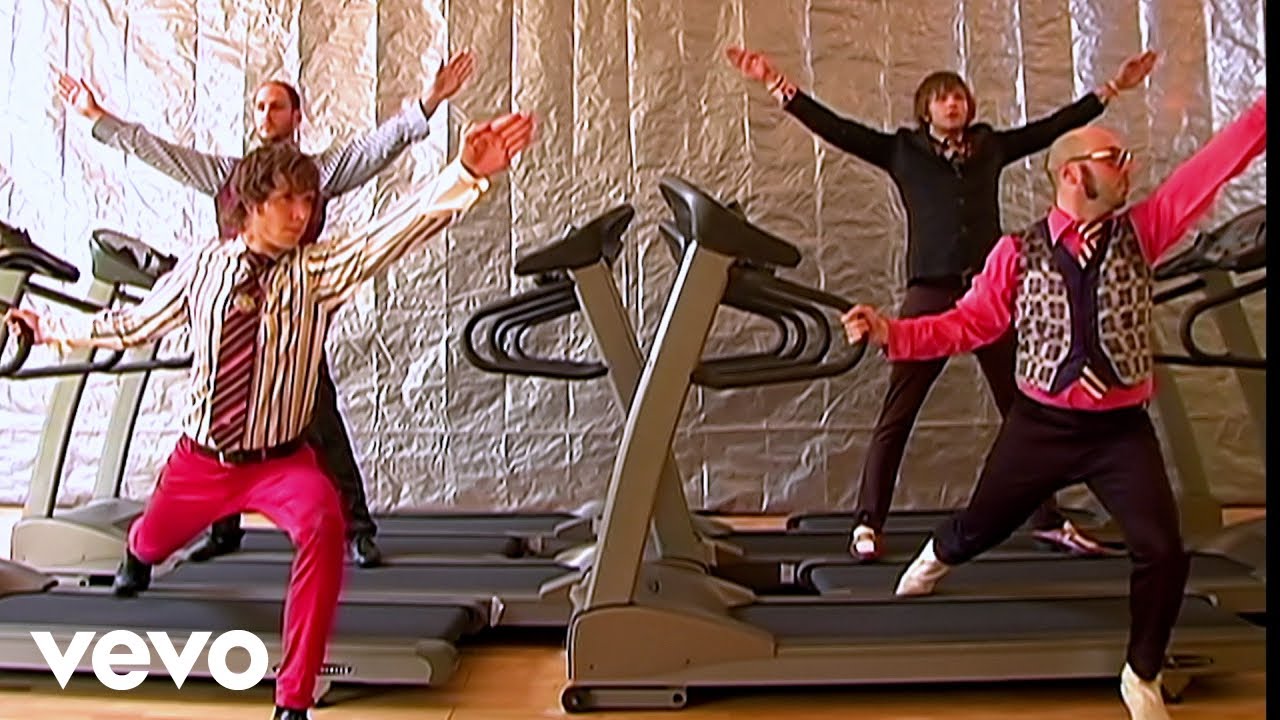
Four men. One take. Six treadmills. A generation of viewers who learned where the sync moment is and rewound to feel it again. The video is older than the heatmap by sixteen years.
The feel-again rewind is what happens under the chord change in a song that broke your heart in college, under the kiss in the video for a song you played at your wedding, under the moment the dog runs across the airport to find the soldier who just got home. The brain does not need any more information. The brain has the information. The brain just wants to spend another six seconds in that specific feeling before it lets the feeling go.
This is the rewind of refusing to be done. It says: the next moment can wait. I am not finished with this one.
How Long the Audience Was Already Doing This
The Most Replayed graph is four years old. The behavior the graph measures is much older than the graph. Every video the heatmap is now able to read has been collecting rewinds quietly for as long as it has been on YouTube. The graph just gave the platform a way to count what the audience had been doing the whole time.
The chart below shows how many years each of the three videos in this column had been earning rewinds before YouTube agreed to measure them. The Most Replayed feature sits at the bottom. The behavior it now describes sits above it, in three thick pink bars that all started before the heatmap was even a slide in a product deck.
How Long Each Video Has Been Earning Its Rewinds
Years on YouTube before the Most Replayed graph existed to count them
Sources: Wikipedia (OK Go "Here It Goes Again," Smarter Every Day, Bill Wurtz), YouTube upload dates on the videos themselves, 9to5Google launch coverage of Most Replayed (May 18, 2022). Bars scaled so OK Go fills the chart width.
The OK Go bar at the top is sixteen years older than the heatmap that now describes it. Viewers were going back to the treadmill sync moment in 2007. They went back in 2010 from a dorm room. They went back in 2015 from a laptop on a bus. They were already doing the thing the graph would eventually measure, and they were doing it without anyone watching them do it. The heatmap is younger than the behavior. The heatmap is younger than the youngest video in this column.
Three Rewinds. Three Different People at the Scrubber.
The same six seconds on the same graph can come from three completely different viewers. Reading the heatmap as if it were one thing flattens the audience into a shape the audience does not have. The table below is a different way to hold them - three rewinds, three reasons, three different people pressing the same button.
What every column of the table shares is the act. The button is the same button. The graph cannot tell the three people apart. The heatmap rises in the same shape whether you were going back to memorize, to verify, or to feel. The platform sees one curve. We are the ones who know we were three different people doing it.
What I Think You Should Do
Ethan made the analytics case this morning. He is right. If you have a YouTube channel, you should open your Most Replayed graph tonight and look at it. The peak tells you something the retention curve cannot. The peak is where your audience pressed the button on purpose.
The thing I want to add is for the rest of us. The viewers. The ones who built four years of heatmaps and have, for the most part, no idea we did.
Sometime soon, you will be watching a video. You will hear a line, or see a moment, or feel something on screen, and you will reach for the scrubber. You will rewind six seconds. The graph at YouTube will move by one pixel because of you. Next time you do it, notice which of the three rewinds you just made. Notice whether you were memorizing, verifying, or feeling. Notice which version of yourself wanted that six seconds again. Notice that you did not have to do it. The video would have moved on. You chose not to let it.
That is, four years in, the most honest thing the Most Replayed heatmap has ever done. It has not made the audience louder. It has not made us comment more. It has not made us subscribe. It has made the audience visible to itself - shown each of us, in a small gray graph above the progress bar, the second a few thousand strangers refused, with us, to let go. The peak is not a moment in the video. The peak is a small monument to the people who decided, individually, that they were not done yet.
The kettle is finished. The line is in your head. The bike still goes the wrong way. The four men still lock into the same step at the same second. The graph still goes up because you were here, in a kitchen, on a Tuesday, on the night of the heatmap's fourth birthday, choosing one more time to sit with a moment a second time. That is the thing the platform learned how to measure four years ago. It is also the thing we were already doing.
Join the conversation